Interpretation of Results
Introduction
Phonexia Voice Inspector (VIN) is a tool for forensic automatic speaker identification, compliant with the Methodological Guidelines for Best Practice in Forensic Semiautomatic and Automatic Speaker Recognition, published by the European Network of Forensic Science Institutes (ENFSI). This post explains individual Speaker Identification score types and ways to visualize the results in a Speaker Identification case implemented in Voice Inspector.
Evidence
In VIN, the term evidence has two meanings. In general, it refers to any SID score that the system calculates for any pair of recordings in the case. These scores are the output of the Phonexia SID technology which runs in the background of VIN. VIN contains the new generation of SID XL5 with deep neural networks. All these scores are plotted on the horizontal axis in the Probability Density Function (PDF) plot:
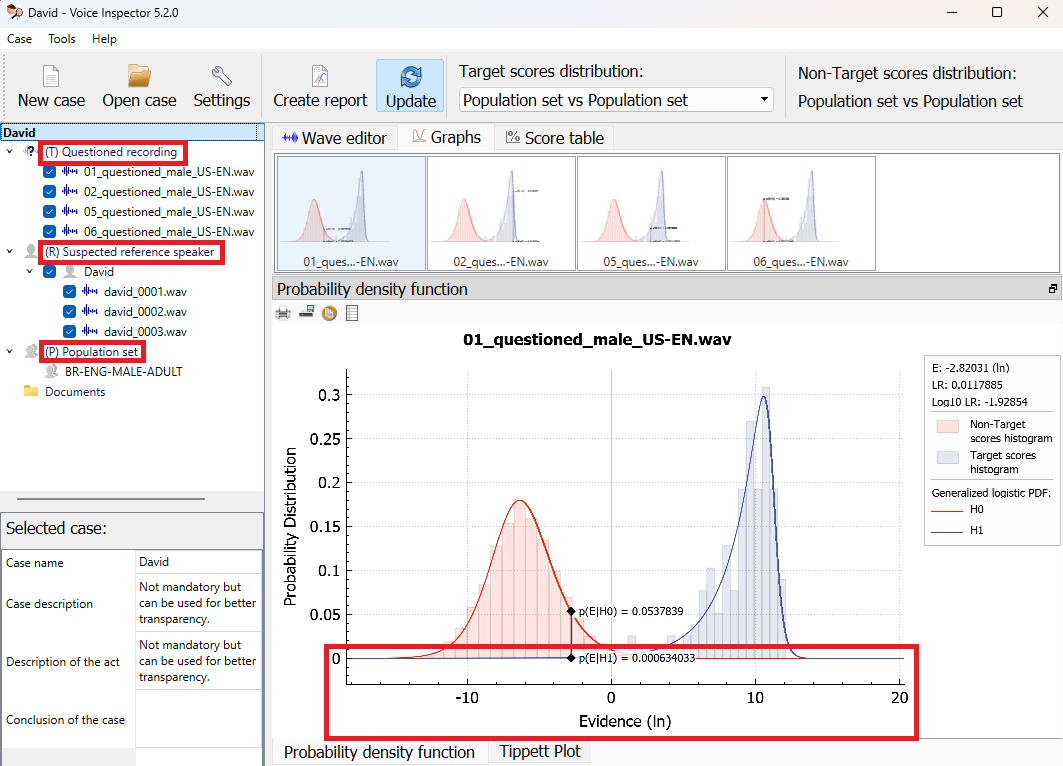
There are three kinds of the "evidence" in Voice Inspector:
- The Target Scores, i.e., all the scores for the same-speaker comparisons,
which in VIN are based on the comparisons of the recordings of the
Suspected reference speaker with each other. They are used to calculate
the probability of a SID score in case we compare two recordings of the same
person. There must be at least three Suspected Speaker recordings to
enable the calculation of the Target Score scores – with just two recordings,
there is only one comparison, which is not enough to calculate the
probability distribution.
VIN also introduces a new option for target score calculations which uses the comparison of audio files of the same speaker in the Population Database.
In a well-calibrated system, the Target scores should be positive numbers. - The Non-Target Scores, i.e., all the scores for the different-speaker
comparisons, which are based on the comparisons of the Population
Database with either the Suspected speaker recordings or the
Questioned recordings (this can be changed in "Settings > Scoring" of
VIN). They are used to calculate the probability of a SID score in case we
compare recordings from different people.
In a well-calibrated system, the Non-Target scores should be negative numbers. - Comparisons of the Questioned recordings with all the Suspected Speaker recordings, which are referred to as Evidence.
Finally, there is the specific meaning of Evidence, which is the average, or arithmetic mean, of the SID similarity scores of the Questioned recording and individual Suspected Speaker recordings. In the following, the term Evidence with capitalization or the symbol E will be used in this specific meaning. This Evidence is the value shown in the legend to the PDF plot as "E":
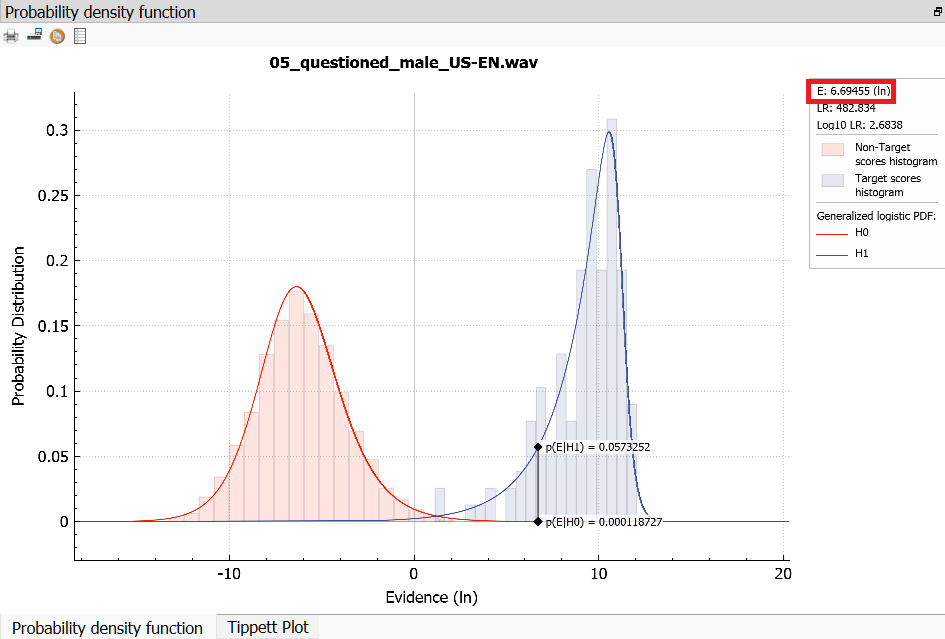
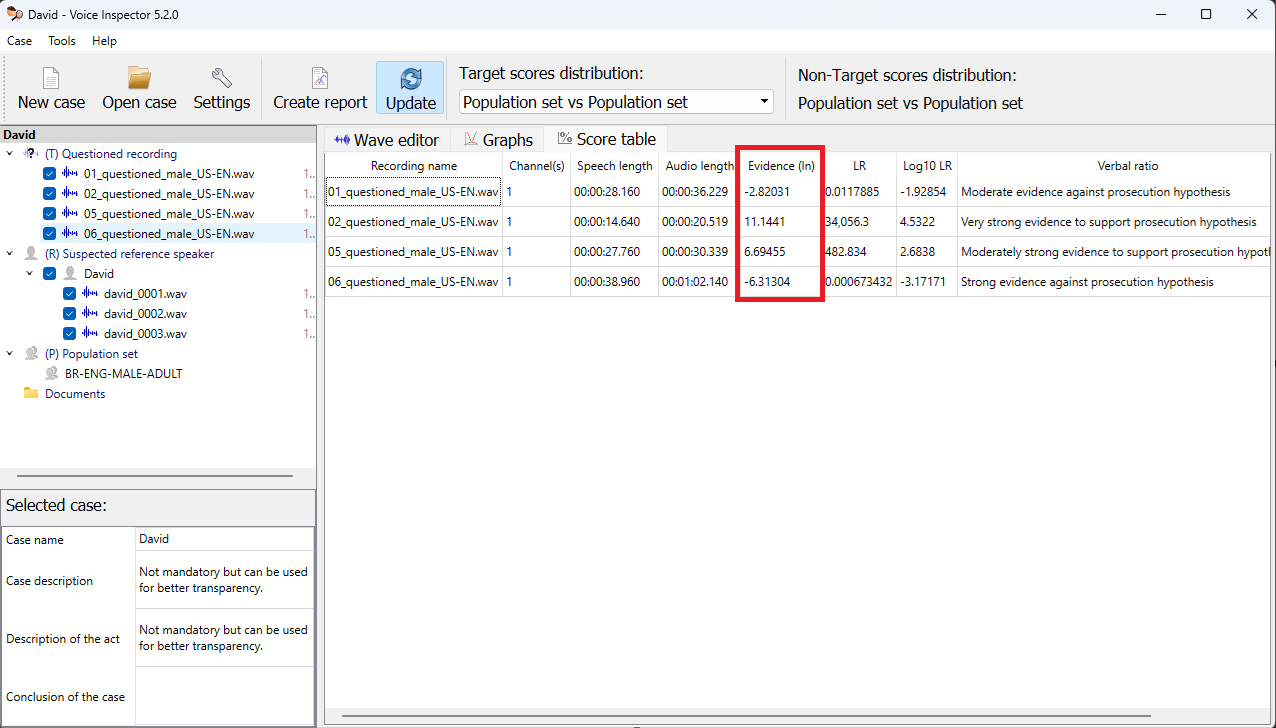
The Evidence values for all the Questioned recordings are also shown in the score table:
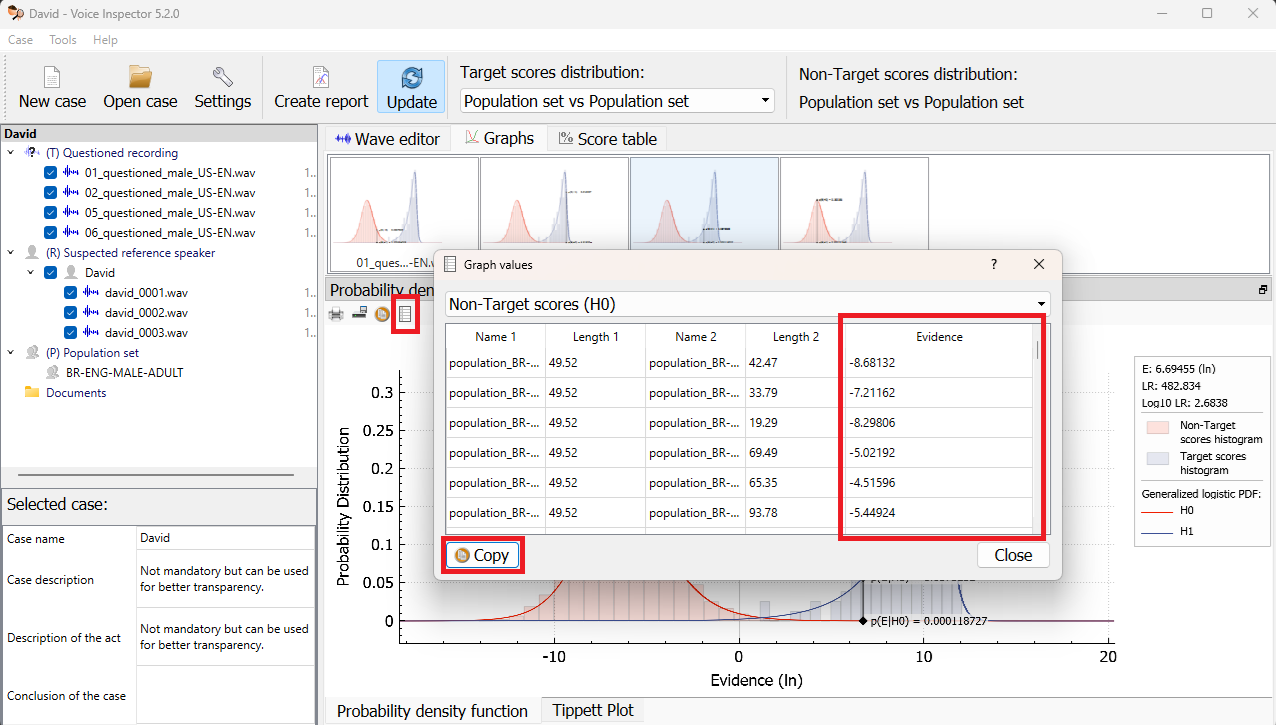
The individual Target, Non-Target, and Evidence scores can be inspected in the Graph values table. From here, the Target and Non-Target score values can easily be copied and used in the SID Evaluation tool:
Likelihood Ratio
The Evidence, i.e., the similarity score of the Questioned and Suspected speaker recordings, is the information that the end user is most interested in. However, the Evidence itself is a score from the SID technology which is not necessarily calibrated for the specific case (recall the above description of "well calibrated" with respect to Target and Non-Target scores). To provide results in accordance with forensic science and practice, the Evidence is evaluated with respect to two complementary hypotheses:
- Hypothesis 1: The Suspected speaker is the source of the Questioned recording - this hypothesis is represented by the Target scores.
- Hypothesis 0: The Suspected speaker is not the source of the Questioned recording - this hypothesis is represented by the Non-Target scores.
The Evidence value for a particular combination of a Questioned recording and Suspected Speaker is drawn as a black vertical line in the PDF plot, where it intersects with the Target and Non-Target distribution curves, in blue and red, respectively:
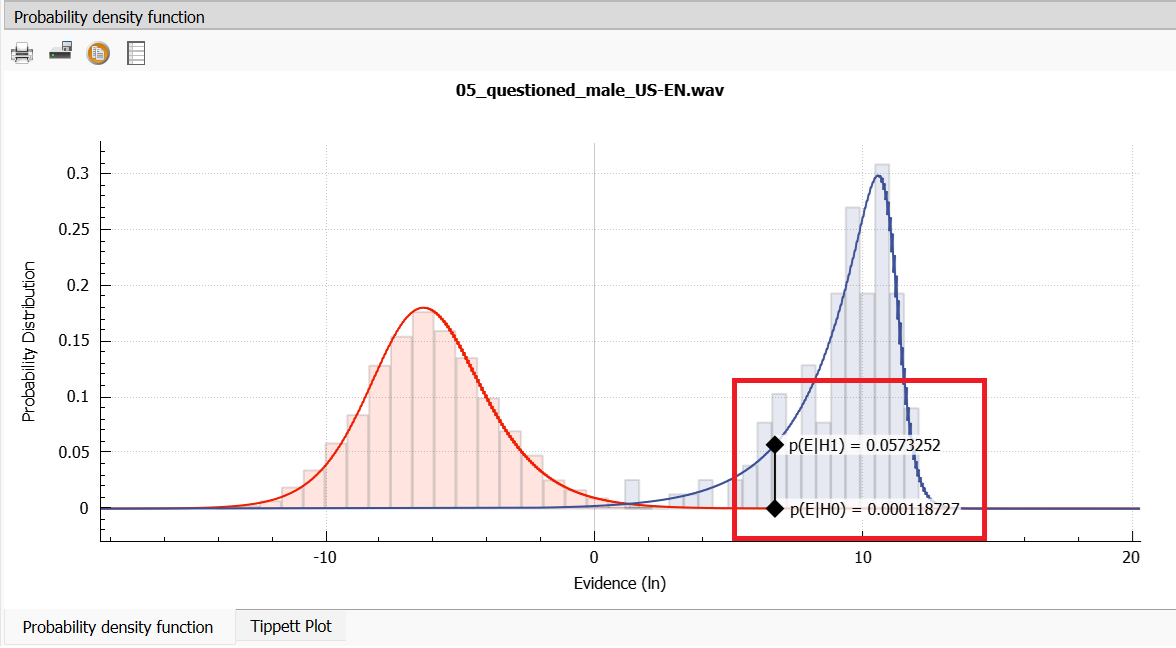
In this way, VIN calculates the probabilities (shown as p(E|H1) and p(E|H0)
in the PDF plot) that a given Evidence value belongs to the Target or Non-Target
score distributions and the ratio of these two probabilities is the actual
output of the forensic system: the Likelihood Ratio (LR). In other words,
the LR is the answer to the question, How much more likely is it that the
system returns a given Evidence value when the Suspected speaker is the
source of the Questioned recording than it is likely that the system returns
such an Evidence value when the Suspected speaker is not the source of the
Questioned recording?
Likelihood values can range between two extremes: p = 0 (false) and p = 1 (true). Hence, the likelihood Ratio can theoretically have values from 0 to positive infinity. LR values closer to 0 mean the Evidence is more probable under Hypothesis 0 ("different speakers"). LR values closer to positive infinity mean the Evidence is more probable under Hypothesis 1 ("same speaker"). LR value 1 means that the Evidence is equally likely under both hypotheses.
In a well-calibrated system, LR = 10 means it's 10 times more likely to get
such Evidence if the Suspect is the source of the Questioned recording, and
LR = 0.1 means it's 10 times more likely to get such Evidence if the Suspect
is not the source of the Questioned recording. This information can then be
taken to court to re-evaluate any other pieces of evidence and prior odds that
the judge may already have.
Let's have an example:
Based on the evidence of fingerprints and eyewitness testimonies, the judge formulates the prior odds: he or she thinks the suspect is guilty 1000:1 (it's one thousand times more likely that he or she is guilty). Based on the automatic Speaker ID analysis, the forensic expert reports the
LR 0.01, or1:100(the Evidence one hundred times more likely if the Suspected speaker is not the source of the Questioned recording). The judge should re-formulate the posterior odds to 10:1 (it's just ten times more likely that the suspect is guilty).
It's important to keep in mind that this reasoning assumes that the analyzed audio files are collected and processed properly, i.e., the Suspected Speaker recordings contain the voice of the suspect, all the recordings contain enough speech, etc.
Verbal ratio
The Likelihood ratio values can be expressed verbally, so they are more comprehensible. In VIN we use the following scale:
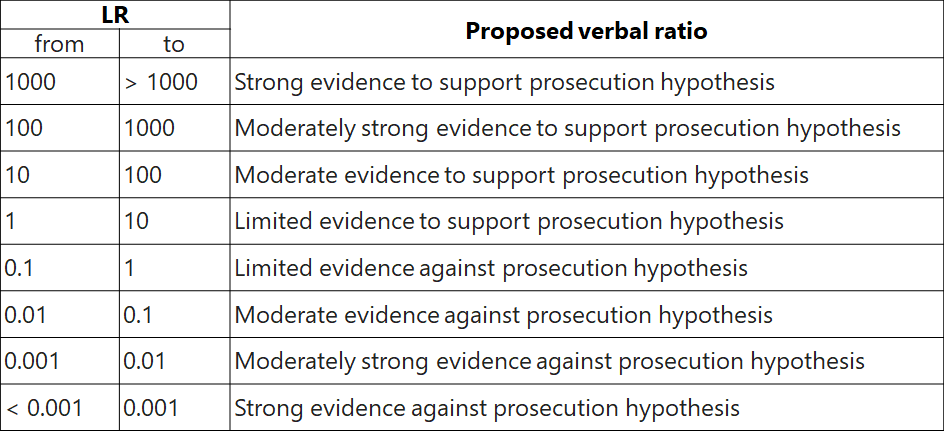
However, the end-user can also redefine the scale and add new categories, e.g., for "very strong" or "extremely strong" evidence, as suggested in the ENFSI Guideline for Evaluative Reporting in Forensic Science.
Log-Likelihood Ratio
Likelihood Ratio values are useful for expressing the strength of evidence, or in other words, how much more the evidence is likely under one hypothesis than under another one. However, the fact that the LR values range from 0 to positive infinite and are centered around 1, makes them difficult to understand if they are visualized in a plot. This is easily solved by taking a logarithm of the LR value. By doing this, the final Log-Likelihood Ratio (LLR) values in a well-calibrated system are centered around 0 and symmetrically spread towards negative infinity (different speakers) and positive infinity (same speaker).
The Target, Non-Target, and evidence scores have the form of Log-Likelihood Ratios, in contrast to the Log10 LR values in the Score table, they are based on the Universal Background Model of the SID technology. That means, the technology compares the probabilities that two recordings come from the same person or different people based on the speakers included in the training data. By using the Target and Non-Target score distributions to interpret the Evidence, the forensic system calibrates the results to a particular type of data to which the Universal Background Model itself may not be well-calibrated.
The default output of the SID system uses natural logarithms (ln). In the
forensic field, however, base 10 logarithms are used because they can be easily
interpreted with respect to the original LR values, e.g., if LR = 100,000 then
LLR = log10(100,000) = 5. Log-Likelihood Ratio 5, therefore, means the
Evidence is 100,000 times more likely if the Suspect is the source of the
Questioned recording. Similarly LLR value -5 means, the Evidence is 100,000
times more likely if the Suspect is not the source of the Questioned
recording.
The base of the logarithm for the Evidence (ln by default) can be changed in Settings > Scoring. The final output of the system is always based on a decadic logarithm because that is the forensic standard.
Tippett plot
Apart from the Probability Density Function plot, VIN also shows the Target and Non-Target values in the so-called Tippett plot:
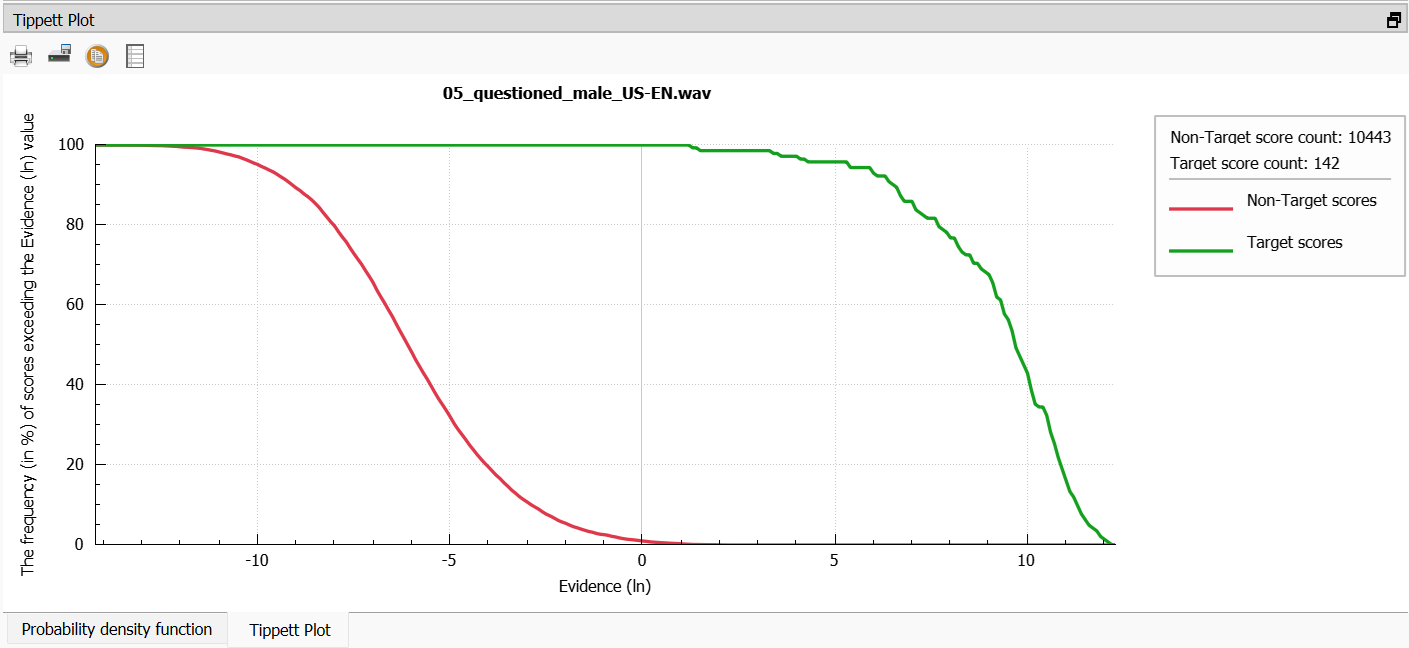
On the X-axis in this plot, you can see the evidence values for the same-speaker and different-speaker comparisons. The Y-axis shows the percentage of the comparisons (or test cases) that exceed a given evidence value. The blue dot in the Tippet plot shows that 10 % of the Non-Target scores have a value over -5 Log10 LR.