SID4 Performance on Intel® Xeon® Platinum 8124M
Benchmark goals
- Find realistic performance using total recording length.
- Find FTRT based exactly on net speech (engineering sizing data).
- Find system performance using all physical cores.
- Find system performance using all logical cores.
Infrastructure setup
An Intel® Xeon® Platinum 8124M is used in a virtual machine with 8 physical cores reserved exclusively for this VM. Hyper-Threading is enabled, providing 16 logical cores available, with 32GB RAM, 30GB SSD-based storage, and 1000 I/O operations per second reserved per core.
Benchmark data setup
Data set statistics:
- Number of files: 32; 300 seconds each
- Total length of raw recordings: 9600 seconds
- Total length of net speech: 4224.77 seconds
- Data set contains 44% speech signal, 56% silence or technical signal
- Statistics counted by Phonexia VAD 3.22.1, using “vad_2.bs” settings (AKA strict VAD, without speech context)
Methodology
SID4 performance was measured on a virtual machine with Ubuntu 18.04 installed as the host OS.
SID4 v3.21.3 command line was used, supported by VAD 3.22.1 command line for collecting statistical metadata.
The virtual machine was reserved solely for this measurement experiment.
Technical details:
- Driven by a bash script in a terminal emulator
- The measuring script was run 50 times for each number of used cores (physical and logical)
- Collected data were saved in a CSV file
- FTRT numbers were calculated as the median from collected measurements
- Total system performance is a simple multiplication of the computed FTRT equivalent
For more information on the methodology, refer to: Measuring of a software processing speed – what is the FtRT (Faster than Real Time)
Initially, our customers usually only have access to a captured recordings data set from a specified time period with information such as:
- Total number of recordings
- Average file size of captured recordings
- Total number of captured hours
Customers typically do not have information about the ratio between speech signal and technical/silence parts of the recordings at the beginning.
The speech/non-speech ratio is detected only after the first Phonexia-controlled analysis and becomes a key factor for precise capacity planning in subsequent stages.
Results
“Captured recordings” refers to archives of recordings gathered by various methods. A typical example is recording archives created by call centers that must record business calls for extended periods due to general country law requirements. Law enforcement agencies may use different methods for gathering recordings, but the principle is very similar.

Based on the data measured on the data set described above, we can conclude the following for Intel® Xeon® Platinum 8124M:
- Phonexia SID4 using the L4 model can perform up to 180 FTRT using 1 physical CPU core when processing audio data containing 44% speech.
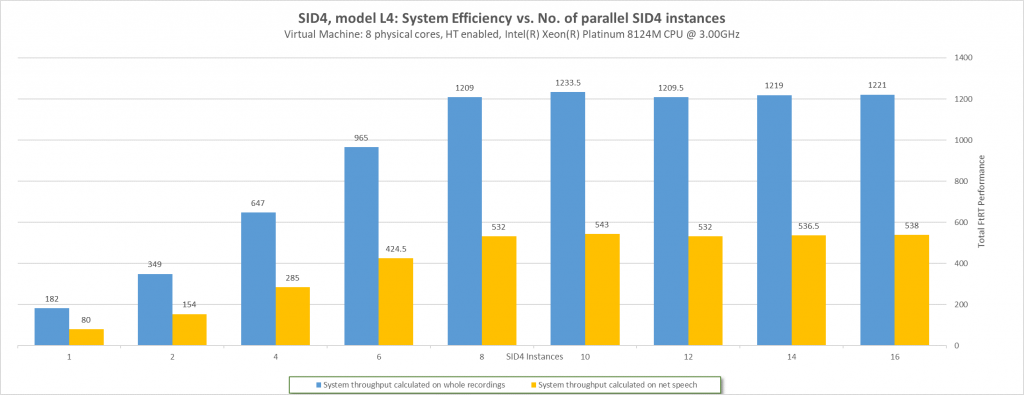
- Optimal system performance was observed with 8 SID4 instances using 8 physical CPU cores on a single CPU.
- Under these conditions, the total system performance is 1200 FTRT when a single CPU is used.
- The CPU Hyper-Threading feature does not provide any performance improvement for SID4.
The following data visualization shows the performance of Phonexia SID4 on a specific CPU family and type. Explanations on how to interpret this data are provided below each chart. The raw data collected during measurement are included in Appendix 1.
Visualization

Description:
- Green line (FTRT based on recording length) shows how the system performs on the specified data set. This line represents the most realistic performance in a system where only the total number of captured recordings in hours is known.
- Orange line (FTRT based on net speech) demonstrates system performance based solely on “net speech”. In other words, it shows the scenario where 100% of the recordings' duration contains speech (or utterance). This metric represents an exact engineering approach, but does not accurately reflect the real world.
- Orange bar, CPU core, shows the number of physical cores available on the tested system.
- Blue bar, SID4 instances, shows the number of parallel SID4 processes initiated.

Description:
- X-axis shows how many SID4 instances were activated in parallel processing.
- Blue bar shows total performance based on the length of raw recordings in the data set.
- Orange bar shows recalculated performance based on the “Net_Speech” length calculated from the original recordings in the data set.
How to understand the results context
As seen above, the measurement indicates that the performance curve increases significantly up to 8 SID4 instances running on 8 physical cores. There is a slight performance drop when comparing configurations with 1 SID4 instance running on 8 physical cores to 8 SID4 instances running on 8 physical cores, as displayed in Figure 2.
Hyper-threading
When 8 physical cores are used, the benchmark test initiates additional SID4 processes, hoping that hyper-threading might help.
This hypothesis, unfortunately, cannot be confirmed. See Figure 2, which clearly shows that initiating more SID4 processes than the number of available physical cores does not provide better performance than when the reserved physical core count is enabled in the virtual machine.
With Phonexia SID4, hyper-threading does not offer any advantage on the hardware configuration shown above, because Phonexia technology can utilize the full physical capacity of the given CPU in its physical cores. Thus, Hyper-Threading, as a part of CPU virtualization, cannot deliver better performance based on this parallel computation paradigm.